Four years of household energy costs and emissions
18 April 2021
In the last few years, we have been slowly electrifying our transport and home heating/cooking needs.
The first step we took was installing solar panels (PV) in 2015. This post charts the changes in energy costs and the CO2 emission reductions that have happened since then.
Energy costs
This chart shows the energy costs by fuel type. During 2017 and 2018, you can see that diesel and gas were the most significant portion of our energy costs.
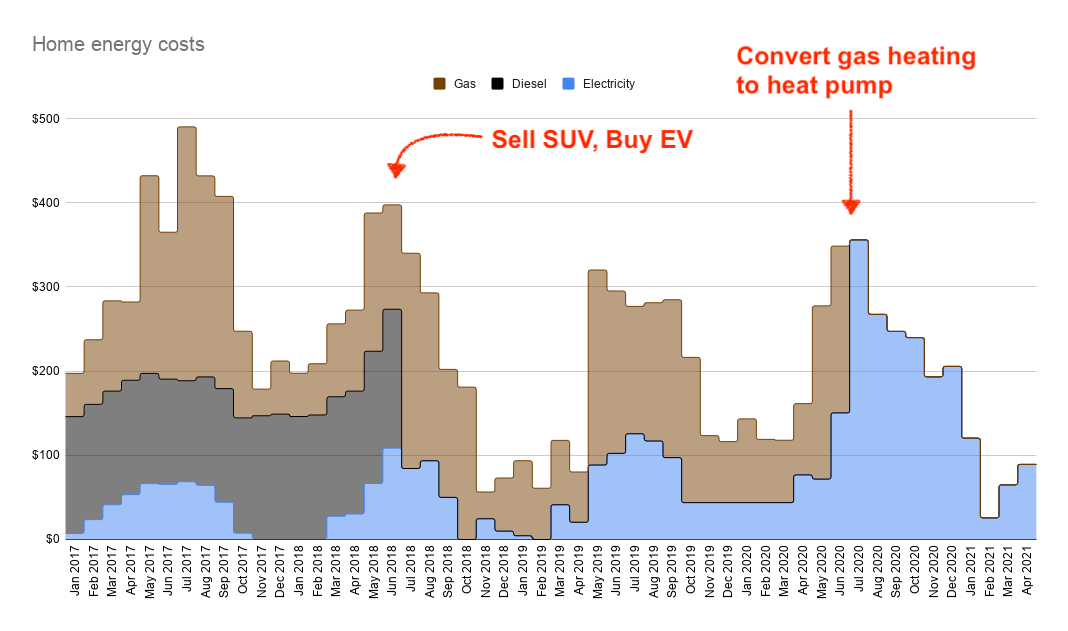
Trade SUV for EV
When we sold our diesel SUV in mid-2018, the diesel component (25 litres each week) disappears and is replaced with a very small amount of additional electricity. The reason this is small, is that we try to charge up the car while the sun is out - hence reducing the amount of electricity we need to buy from our electricity retailer.
Small/missing electricity bills in summer
You will notice the summer months of 2017, 2018 and 2019 have little or zero electricity costs. This is because our solar panels are generating more energy that we can use. The excess is exported to the grid, for which we receive a small credit which is used in early autumn.
Switch from gas central heating and hot water
In mid-2020, we replaced our aging gas boiler and central heating system with an electric heat pump equivalent. The impact on our total energy spend is fairly minor - we were on an 8c per kWh plan with our gas retailer at the time. The 300-400% efficiency of the heat pump solution results in a similar overall spend.
Emissions
This chart shows our emissions for the same period as the chart above.
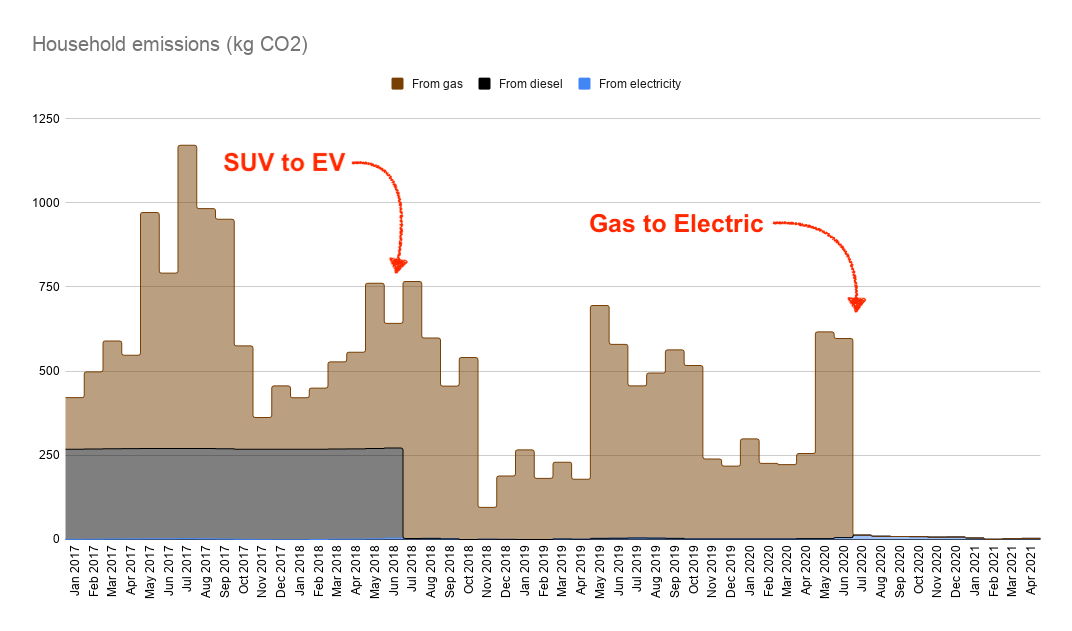
You can see the impact of the SUV/EV switch in mid-2018 with our emissions dropping by about half.
Then in mid-2020, the removal of the gas supply removes about another half of our emissions.
This chart shows how clean electricity is when compared with fossil fuels. The CO2 emissions from electricity generation barely register. This is because our electricity provider is carboNZero certified, so the only CO2 emissions are due to line losses from the distribution.
Energy costs by year
The final chart shows the energy spending with a separate line for each year.
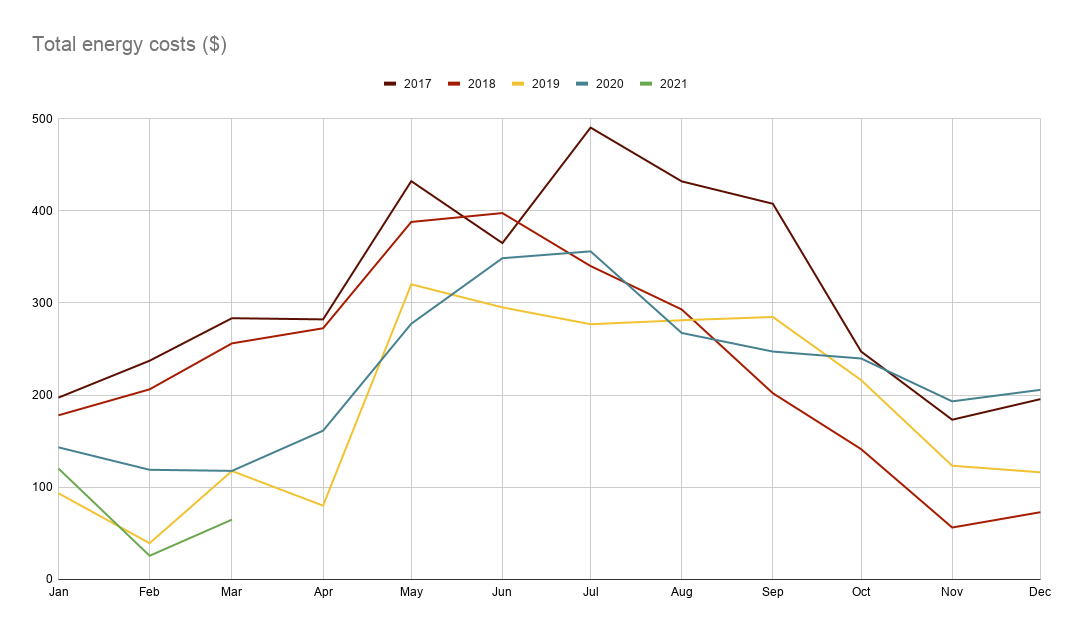
You can see that there is quite a bit of variation each year, but there is an overall trend downwards.
Although not shown in any of these charts, I think the biggest saving is the reduction in vehicle maintenance. We were spending $1000-2000 each year on servicing and repairs for our SUV. I think the only maintence our EV has required has been a new pair of wiper blades.
Summary
The switch from SUV to EV had the biggest impact on our energy costs.
The running costs of gas central heating are similar to heat pump based heating.
The diesel SUV and gas central heating were our most significant sources of pollution. Switching to cleaner electrical energy has virtually eliminated all our heating and transport based CO2 emissions.
Related posts
- My Tesla Powerwall Experience
- Review of the Mitsubushi Ecodan
- All about solar panels
- Comparison of fossil-fuel with electric-only energy costs for spring
- Household energy costs comparison for winter
- Price Comparison of Electricity and Gas
- Energy efficiency after 1 week
- Conversion of gas central heating to electric
- Recording our carbon footprint at home
- Please don’t wait for the Politicians